

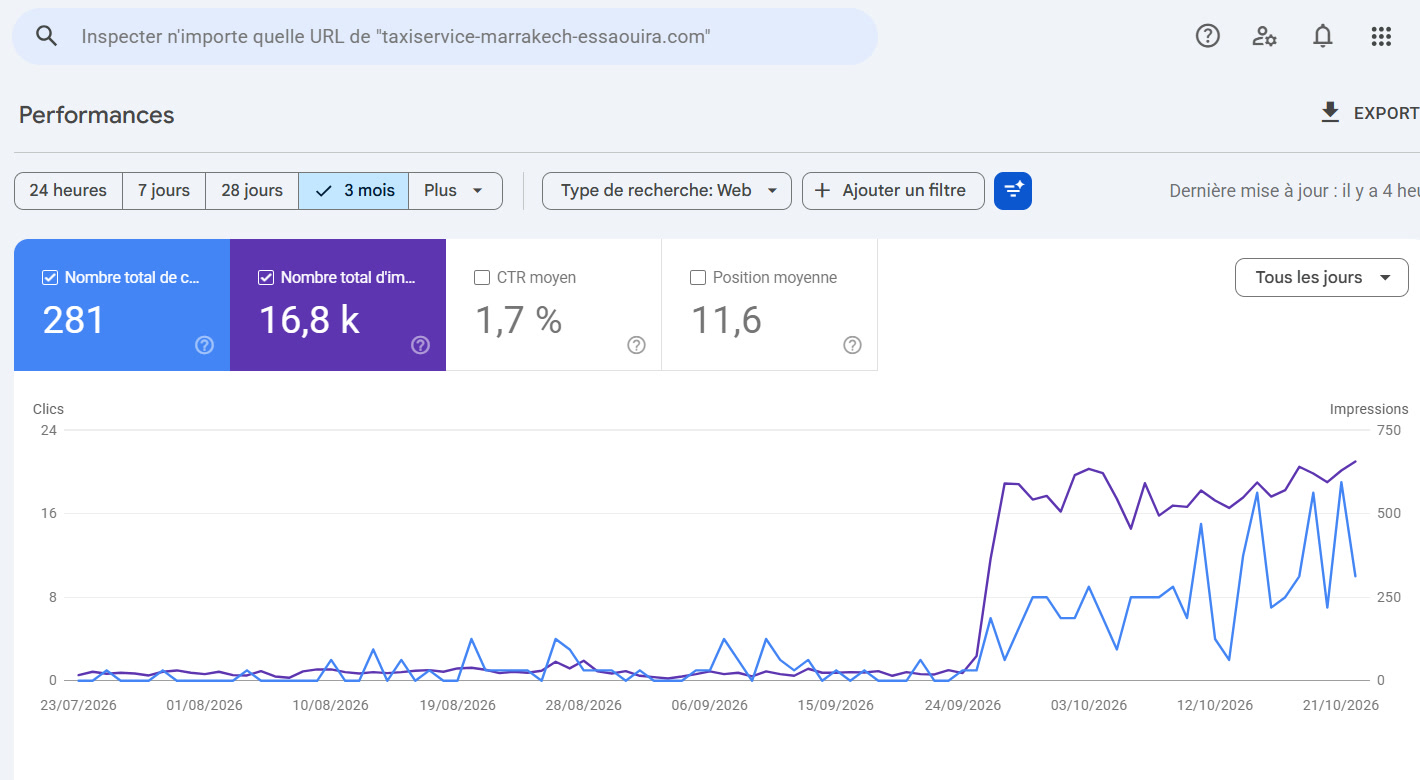
SEO gets talked about a lot, but rarely with real numbers on the table. Here is a raw Google Search Console screenshot, taken on 24 October 2026 on the site of one of our clients, Rouasse Travels, a private transfer and excursion company based in Marrakech (taxiservice-marrakech-essaouira.com). Let's read it line by line: what it shows, how to interpret it, and what it leaves out.
The four numbers at the top of the report
Search Console sums up the selected period in four metrics. Over these three months:
- 281 clicks: how many times someone clicked through to the site from Google's results.
- 16,800 impressions: how many times a page of the site appeared in the results, clicked or not.
- 1.7% average CTR: the share of impressions that turned into a click (281 out of 16,800).
- An average position of 11.6: the site's average rank across every search it appeared in.
On their own, these numbers don't say much. The chart below them tells the story.
What the chart shows
The purple line is impressions per day; the blue one is clicks. From late July to late September, the site hovers around thirty impressions a day and zero to four clicks. It is indexed, but Google hardly shows it.
On 24 September the purple line jumps: over 500 impressions a day within a few days, then steady growth to about 650 by late October. Clicks follow a little later, with peaks of 15 to 19 a day in October.
A jump like that almost never happens by chance. It is the point where Google starts treating the site's pages as relevant for what travellers search, things like "taxi Marrakech Essaouira" or "Marrakech airport transfer". The groundwork (one page per route with clear prices, a site in French and English, fast on mobile) ends up being recognised all at once rather than bit by bit.
Why CTR and position are still modest
A 1.7% CTR can look low. It is mostly explained by the average position: at 11.6, the site often sits at the bottom of page one or the top of page two, where few people click. When a page climbs a few places into the top results, its click-through rate rises sharply with the same number of impressions.
So the next step for this site is clear: lift the pages that already appear often but too low, rather than chasing new impressions.
What the screenshot doesn't tell you
- It only covers Google "Web" search: not Google Maps, not Google Images, not other search engines.
- It doesn't show bookings. A click is not a customer: to measure enquiries, WhatsApp messages and forms have to be tracked separately.
- Three months is a snapshot. The real test is whether the curve holds and keeps climbing in the months that follow.
Tracking these numbers for your own site
Search Console is free. Once your site is verified (through your domain name or a tag), open the "Performance" report, pick a three-month period and tick all four metrics. The "Queries" tab shows the searches that bring you impressions, the "Pages" tab the pages to work on first. A weekly look is enough to spot a trend.
FAQ
What is the difference between an impression and a click?
An impression is counted as soon as a link to your site appears in the results someone sees. A click only counts when they actually click it.
Is an average position of 11 bad?
Not necessarily. It is an average across every search: some pages may rank 3rd and others 30th. Mostly it tells you there is room to improve.
How long does it take to get a curve like this one?
It depends on the industry and the competition, but it usually takes several months of steady work. We go into those timelines in our article on how long SEO takes to show results.
Curious about what Search Console says about your site? Ask us for a free audit and we'll explain it in plain terms.
Never miss an article
Join our readers and get weekly insights on SEO, web design and digital marketing for the Moroccan market.